Bit Error Location Analyzer Quick Start
This Quick Start guide will help you set up your BitWise Bit Error Location Analyzer quickly so you can begin making measurements. The first step enables you to power on the device and get connected to the user interface which enables you to configure settings and see results. The second step requires that you have a test signal connected to the first data channel input of the Bit Error Location Analyzer, and you provide a synchronous clock associated with the data bits plugged into the clock input. The bit stream should be a PRBS pattern, and the clock signal may be full or half bit-rate.
To view a video introduction to the Bit Error Location Analyzer, click here.
Required Equipment
- In the box
- BitWise Device
- Power Adapter and Cord
- Also required
- LAN
- LAN-connected computer running web browser
- Ethernet Cable
- Single-ended or Differential SMA cable(s) providing Data signal bit stream consisting of PRBS pattern at 1.0 to 28.0 Gbps. The electrical signal levels of these signals must fall between -2.0 and +3.0 volts, and be terminated 50 Ohms to 0.0 V. A typical amplitude for these signals is 250 mV to 1,000 mV.
- Single-ended SMA cable providing Clock signal synchronous with the Data signal at full-rate or half-rate. The electrical signal levels of these signals must fall between -2.0 and +3.0 volts, and be terminated 50 Ohms to 0.0 V. A typical amplitude for these signals is 250 mV to 1,000 mV.
- One 50-Ohm SMA Terminator used for terminating the unused leg of the differential data input if providing a single-ended signal (optional).
Setting Up the Bit Error Location Analyzer
- Make sure the power switch on the rear of the Bit Error Location Analyzer is in the OFF position.
- You may use the banana jack on the rear panel to ground the device chassis.
- Plug your BitWise device into the network using the Ethernet cable.
- Use the provided power adapter and cord to plug your BitWise device into a power outlet.
- Use the power switch on the rear of the unit to turn the device ON. Wait for the device to initialize.
Wait for the Bit Error Location Analyzer to Initialize
BitWise devices have an LED on the front panel called "READY". This LED provides status of the device's progress through the initialization process:
Power on: Green solid
Operating system initialized: Off
Device server initialized: Green single-blink
Web server initialized: Green double-blink
User interface website available: Green triple-blink
Initialization complete: Green solid
Access the User Interface Website
Use a computer connected to the same local area network as the device, access the user interface website by entering your device's IP address as the URL in your browser. For help finding your device's IP address, read the guide here.
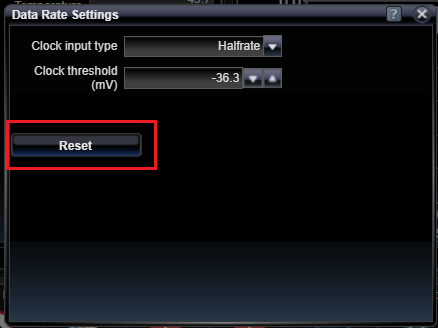
Set Data Rate
Use the Data Rate status bar tool to access the Data Rate Settings view so you can select the clock input type to be full-rate or half-rate. Once this is set, you can press the Reset button and the clock will be examined and a suitable threshold will be selected. Once selected, the bit rate per channel will be shown on the Data Rate status indicator.

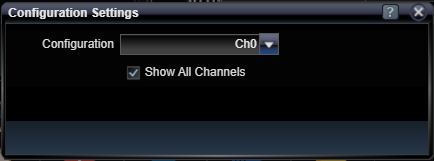
Set Channel Link Mode
The Channel Link Mode setting is used to configure error detection and analysis for use with one or both of the input channels. Using this mode, you can select to measure a single channel (Ch0 or Ch1), or to measure both channels simultaneously (Unlinked), or as a combined/aggregated channel. In the combined mode, you can further select that the two channels can be synchronized independently (Linked), or as a single bit-interleaved PRBS pattern (Interleaved). For the purposes of this Quick-start section, select "Ch0".

Configure the Ch0 Data Input
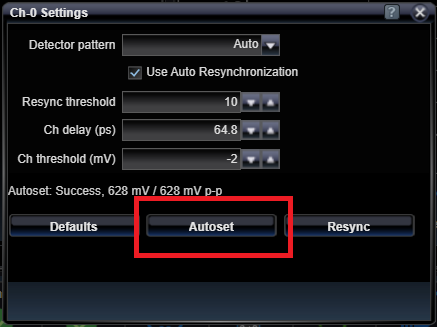
Configure the Ch0 Data input by clicking on the Ch-0 status panel to view the Ch-0 Settings dialog. Select the Detector pattern to be "Auto" and make sure the Use Auto Resynchronization checkbox marked is checked. Then, press the Autoset button. This will take a few moments as the data input signal is examined to determine a good sample point delay and threshold. When the process completes, you will see a brief message such as the one shown below. If the Autoset function is successful and a recognizable PRBS pattern is present on the input, the Ch-0 Status icon will display a green check and the name of the detected pattern will be shown below the icon. If the name of the detected pattern is not correct, then the system is not receiving the proper signal and bit stream. In that case, check your connections and your data source, and make sure to perform an Autoset function if the signal levels change.

Run BERT Applications
Once the pattern type is detected, you can run the BER application to measure the BER of the channel. To do this, press the BERT Interface tab on the right hand side of the display. This will show you three applications grouped together on the main application window: 1.) Information, 2.) BER Error Detector, and 3.) BER Strip Chart.
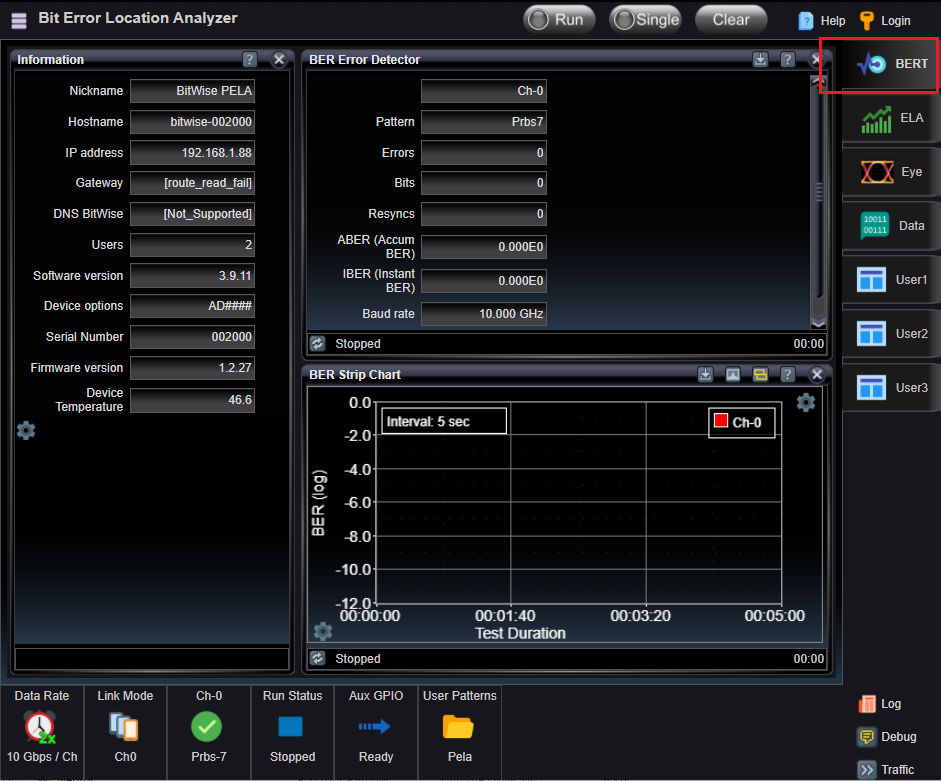
Once the applications are being shown, the only thing you need to do to measure the BER is to press the Run button!
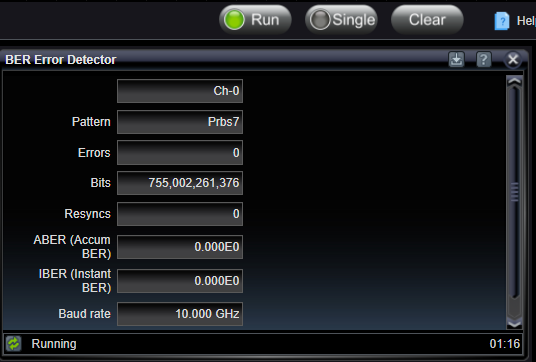
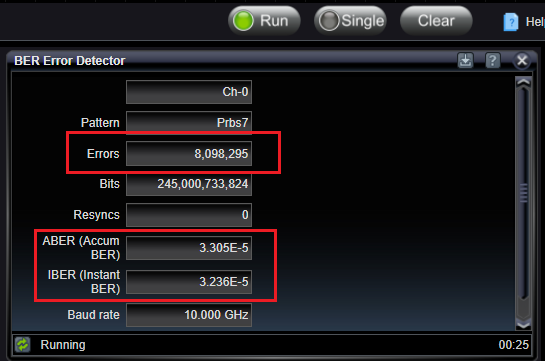
Notice the Pattern being detected and the number of bits climbing, and the number of Errors remaining zero. This shows no BER, which is appropriate since the signal should not have any errors in it in this situation.
Try the Eye Diagram
Another way to get started is to see the underlying eye diagram. To do this, first select the Eye Interface tab to view the Eye Diagram application.
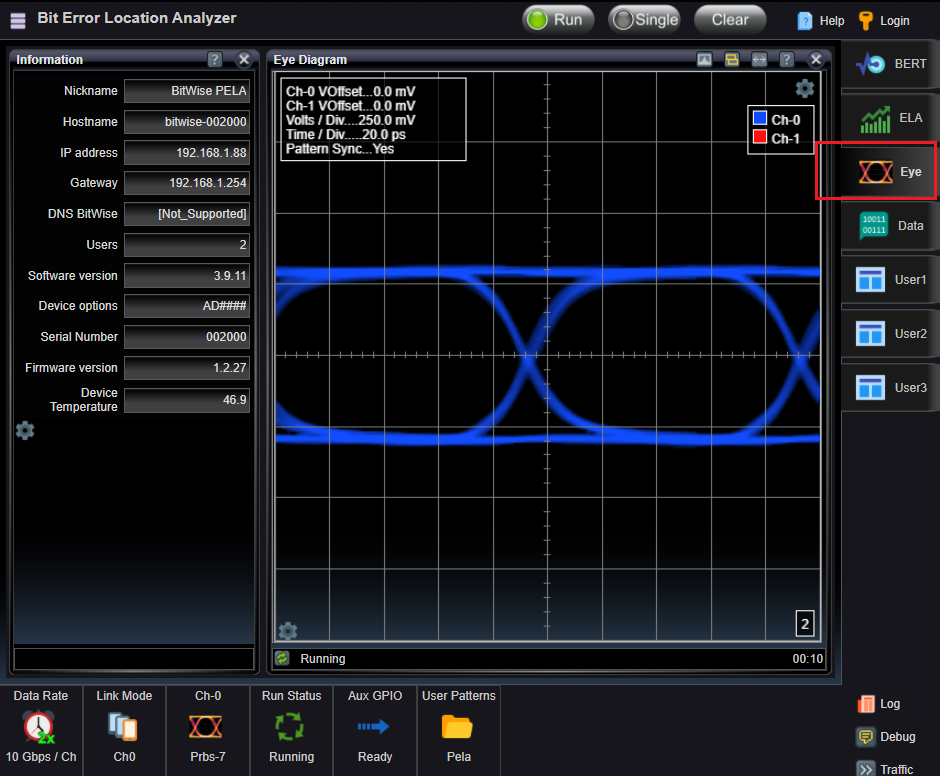
If you select the cog-looking Settings Icon at the top-right of the chart, you will access a panel of settings for the chart. And if you select the Ch-0 checkbox, you will see a target drawn on the chart representing where the sampling point is for BER detection.
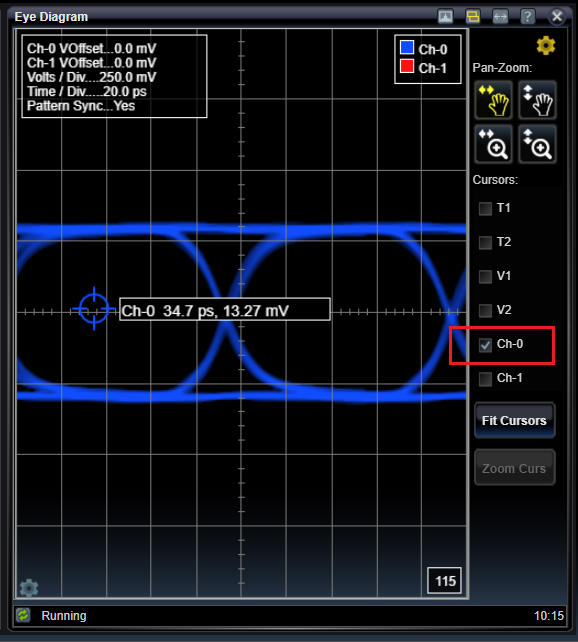
If you press on the target icon, you can drag the sampling point elsewhere. To see the effect of this, stop the eye diagram by pressing the Run button until the green light is no longer show. Then, if you put it above the signal entirely, you will see the PRBS pattern is no longer detected, and instead an All zeros pattern is detected. Similarly, if you drag the sampling point below the signal, All ones will be detected.
Lets try something else. Try dragging the sample point to a spot closer to the high rail of the signal. While the eye diagram is not running, watch the Ch-0 status bar icon and you will eventually see what sampling point creates a bit stream that is no longer recognizable as a PRBS pattern.
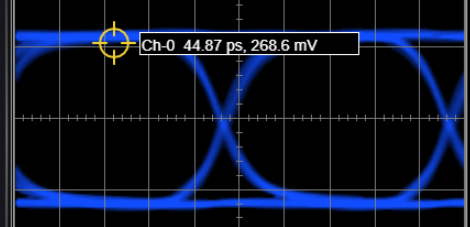
Back up a small amount, and then open the BERT Interface tab and press Run. Now you will see bit errors accumulating during the BER testing session because the sample point is so close to the signal that occasionally it detects an error. With errors present, you can also see statistics for ABER (Accumulated BER - errors during the entire Run session), and IBER (Instantaneous BER - errors during the most-recent integration period (default is 5 seconds).
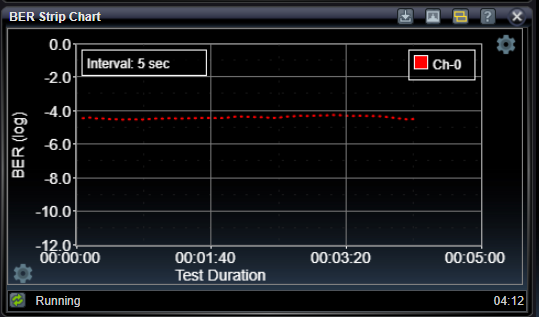
Further, at the bottom of the BERT Interface tab's view, the BER Strip Chart application will now show you a strip chart of instantaneous BER over Time.
See Also