Eye Diagram Application

The Eye Diagram Application presents the probability density function (PDF) analysis of the input data signals synchronized to a clock trigger. It is presented in a two-dimensional matrix of samples. SInce the Bit Error Location Analyzer may have two channels operating at once, the Eye diagram may be configured to show one or two eyes simultaneously, depending on the system Link Mode.
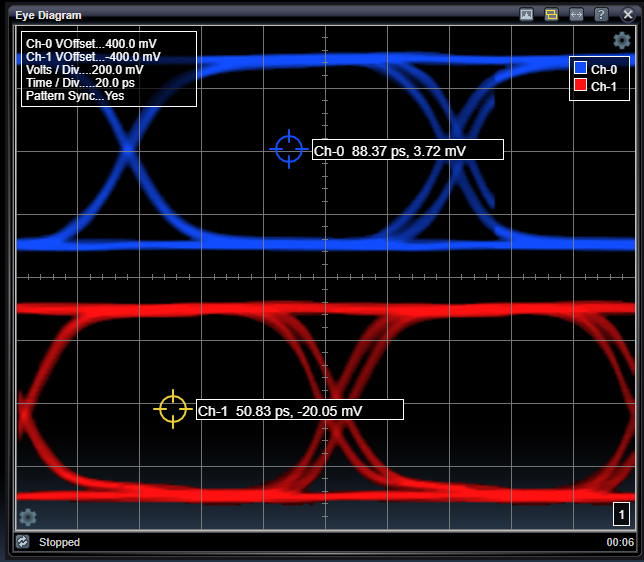
The eye diagram is really a quasi-eye diagram because the sampling mechanism is not the same as a traditional oscilloscope. Some dots may occur inside normally black region in the center of the eye because of pattern properties. This would not happen in a traditional oscilloscope. Still, this view is very helpful to qualitatively compare signal eye performance including rail flatness, voltage noise, jitter, and edge rates.
The Eye Diagram image is acquired by scanning a two-dimensional matrix of time offsets (x-axis) and voltage offsets (y-axis) and detecting the presence of the signal at each cell. The display and cursor settings for the image can be controlled from the ![]() settings menus.
settings menus.
Chart Display
The eye diagram PDF data is displayed using a color gradient in which white is the highest probability and black is the lowest probability.The chart axis are millivolts on the x-axis and picoseconds on the y-axis.
If the Bit Error Location Analyzer link mode is set to dual channel (either interleaved or unlinked) then both input signals will be analyzed in the eye diagram. The signals' relative time and voltage offsets, as well as voltage scaling can be adjusted setting section as described below.
Chart Overlays
The eye diagram chart has two overlays, one in the upper left corner and one in the bottom right corner. The upper left overlay displays which input(s) is being displayed in the chart. The bottom right overlay displays the count of how many eye images have been captured since the app started running.
Status Bar
The bottom bar indicates whether the eye diagram app is actively running. If it is running, then the timer will count how long the app runs for. If a change is made to the app settings, or if the app is restarted, then this timer will restart as well.
Eye Diagram Settings

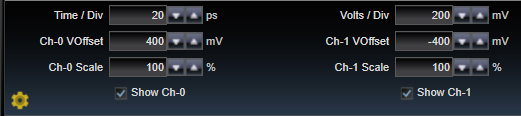
Eye Diagram application control settings provide many settings to configure the eye diagram acquisition and display.
|
Time / Div |
|
|
ps |
Selects the X-axis scaling factor for the the eye diagram display. If multiple channels are being displayed, this effects both channels. |
|
Ch-0 VOffset |
|
|
mV |
Selects the Y-axis offset for Ch-0. This will move the eye diagram up and down on the display, and can be used to stack the eye diagrams on top of each other, or to separate them. This setting is available only if the channel is included in the current Link Mode. |
|
Ch-0 Scale |
|
|
% |
Selects the Y-axis scaling factor for Ch-0. This will effect the size of the eye diagram for Ch-0 only. This setting is available only if the channel is included in the current Link Mode. |
|
Show Ch-0 |
|
|
Checkbox |
Selects whether Ch-0 should be displayed or not. This setting is available only if the channel is included in the current Link Mode. |
|
Ch-1 VOffset |
|
|
mV |
Selects the Y-axis offset for Ch-1. This will move the eye diagram up and down on the display, and can be used to stack the eye diagrams on top of each other, or to separate them. This setting is available only if the channel is included in the current Link Mode. |
|
Ch-0 Scale |
|
|
% |
Selects the Y-axis scaling factor for Ch-0. This will effect the size of the eye diagram for Ch-0 only. This setting is available only if the channel is included in the current Link Mode. |
|
Show Ch-0 |
|
|
Checkbox |
Selects whether Ch-0 should be displayed or not. This setting is available only if the channel is included in the current Link Mode. |
See Also
Chart Quick Controls
Cursor Settings
Display Settings