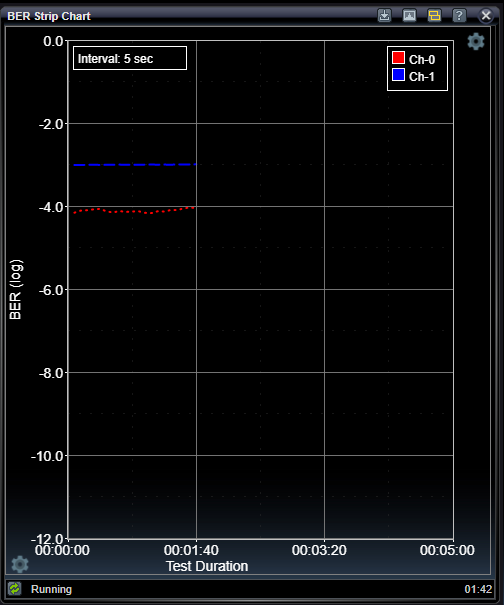
BER Strip Chart Application

The BER Strip Chart application displays up to three channel traces of BER measurements over time. The interval between measurements is selectable from the settings section of the user interface that is accessible by clicking on the gear icon on the bottom-left. You can access Common Chart Controls and Chart Pan Zoom Cursors by clicking on the gear icon on the top-right.

BER Strip Chart Settings

BER Strip Chart application control settings provide configuration for how often measurements are made and how long measurements are kept for.

|
Measurement Interval |
|
|
Seconds |
Setting for the measurement interval in seconds used to define the "Instantaneous" error interval and strip chart reporting interval |
|
History |
|
|
Decimal |
The maximum number of measurements displayed on the chart for each channel. Once this maximum is reached, older measurements are discarded. |
See Also
Bit Error Location Analyzer Group Tabs