Data Wander Histogram Application

The Data Wander Histogram Application allows you to select a window of bits over which mark density will be calculated, and then to display the distribution of those mark density results. For example, if your incoming data stream consisted of 100 Marks (1's) followed by 100 Spaces (0's) repeating, then each time you examined any consecutive 200 bits in a row, you would always have precisely 50% mark density. If, however, you reduced your window size to only 10, you can see that most of the time, you would either be in an all 1's or an all 0's location in the pattern, and only relatively rarely would you be in condition with between 1 and 9 1's in the small window.
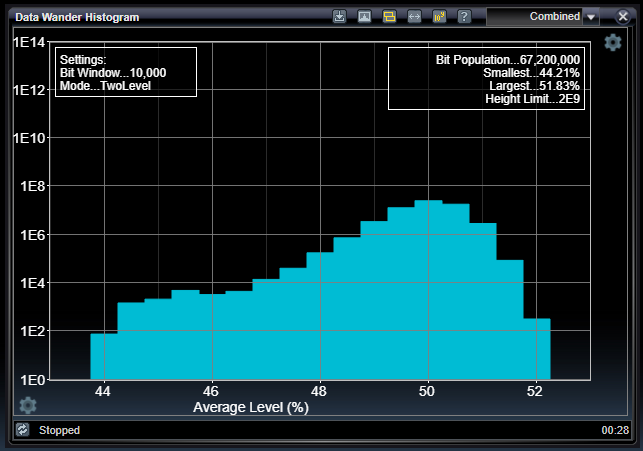
A more realistic case is to consider what happens in a long PRBS31 pattern when examining a relatively short windows of consecutive bits. As you can see in the image below, the most usual situation is roughly 50.00% mark densitity. You can see, however, that the long pattern can sometimes wander above 50% to as much as 53%, and sometimes wander below to as much as 43%. This is useful, for example, if you are analyzing the assumption of average voltage level over some period of time, which is a concept often used during clock recover processing. If the variation of the DC level shown in these analysis results is too great, you can choose to use a longer bit window to try to limit the variations in the average level in any one bit window period.
This analysis is easy to understand as a simple average level between 0 and 1, but it can also be used as a 4-level analysis that can be helpful for PAM-4 diagnostics. In PAM-4, each 2-bit symbol creates one of 4 discrete levels. Assigning two consecutive bits to their corresponding value depends on whether the bits are interpreted in an MSB or LSB format, which is selectable in the settings below.
Data Wander Histogram Settings

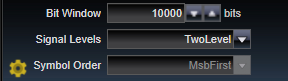
The Data Wander Histogram can be configured to display the distribution of the average level over a selectable bit window, and for two-level (binary) systems as well as four-level (PAM4) systems with selectable bit ordering.
|
Bit Window |
|
|
Decimal>1000 |
Selects the number of consecutive bits analyzed at a time and over which the average level is calculated and added to the histogram distribution. |
|
Signal Levels |
|
|
TwoLevels or FourLevels |
Selects to present analysis using single bits representing values 0 to 1, or as two consecutive bits representing values 0 to 3. |
|
Symbol Order |
|
|
MsbFirst or LsbFirst |
Used when in FourLevel processing, this parameter selects how to convert two consecutive bits into one of the 4 possible levels - Either least significant bit (LSB) first or most significant bit (MSB) first. |
See Also
Bit Error Location Analyzer Group Tabs