Insertion Loss S21 Application (Option)

The Insertion Loss S21 Application is available as an option on every STEPScope™. If your STEPScope does not have this option installed and you would like to order it, please contact BitWise Laboratories.
The Insertion Loss S21 application displays a chart showing the frequency domain insertion response a channel has to a step signal injected through the channel.
Chart cursors can be enabled in the Chart Cursor Settings – accessed by clicking the settings wheel at the upper right of the chart.
|
|
|
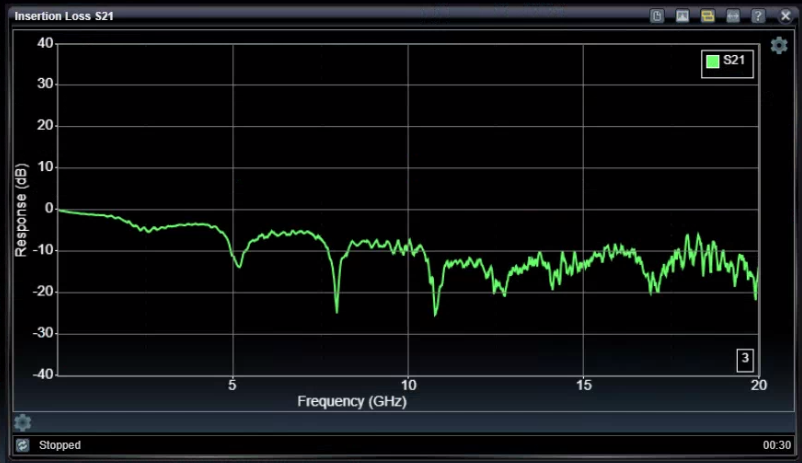
This demonstrates the efficiency of signal energy passing through the channel as a function of frequency. Channel frequency-dependent losses commonly found in bandwidth-limited channels reduce higher-frequency energy while allowing low-frequency energy to pass relatively easier, for example. Energy attenuation is displayed at specific frequency components so that it is easy to see which frequencies are being affected. This is a very useful tool for identifying which elements in a communications channel is hindering high-frequency signals.
The formula for calculating the insertion loss is based on calibrations inherited from the TDT application. First a baseline "Through" calibration is recorded to enable de-embedding of measurement device, fixtures, and cabling. Later, while the "DUT" is connected, the recorded de-embedding information is applied to produce Insertion Loss S21 results that pertain only to the "DUT" portion of the measurement.
Use TDT Calibration to De-Embed Fixture
It is necessary to perform TDT calibrations before using the Insertion Loss S21 application. This provides the system with de-embedding information to remove the impacts of the measuring device and any cabling that may be required to connect to the DUT. When performing the TDT calibrations, you will be asked to provide the "Through" calibration without the DUT. The signal impacts discovered on the "Through" calibration will be removed from the final S21 plot so you see only the impacts from the DUT.
Tuning the Pulser
Pulser parameters such as pulse amplitude and pulse rate can be set in the Pulser Configuration menu − accessed via the Pulser icon in the Status Bar. Higher pulser amplitudes will provide more energy for better calculations, as will more-frequent pulses from higher pulse rates. Longer pulse intervals can provide needed fidelity at lower frequencies but also translate to higher noise-floor for measurements. New TDT de-embedding calibrations are required if pulser characteristics change.
Insertion Loss S21 Settings

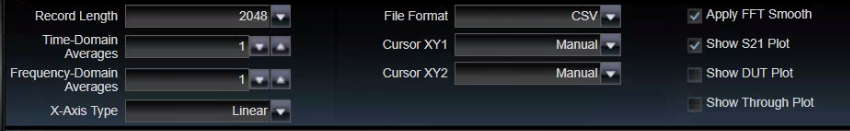
Record Length
|
512, 1024, 2048, 4096, 8192 |
Number of Frequency-domain bins used when calculating FFT results. To calculate these results two times the number of time samples are acquired. |
Time-Domain Averages
|
1 − 20 |
Number of Time-domain buffers averaged together into each Frequency-domain FFT result |
Frequency-Domain Averages
|
1 − 20 |
Number of Frequency-domain buffers averaged together into each displayed result. |
X-Axis Type
|
Linear, Log |
Format of x-axis frequencies (GHz). |
File Format
|
CSV, S1P_RI, S1P_DB |
Format for download file. S1P file formats provide selection to display information in (dB, Angle) or in (Real, Imaginary) pairs. |
Cursor XY1
|
Manual, AutoYS21, AutoYIDut, AutoYThrough, AutoXS21, AutoXDut, AutoXThrough |
Selects automatic modes for cursor-pair X1 and Y1. For AutoY modes, the Y cursor value is selected based on locating the selected Y-axis value associated with the X cursor positioned by the user, and vice-versa for AutoX modes. |
Cursor XY2
|
Manual, AutoYS21, AutoYIDut, AutoYThrough, AutoXS21, AutoXDut, AutoXThrough |
Selects automatic modes for cursor-pair X2 and Y2. For AutoY modes, the Y cursor value is selected based on locating the selected Y-axis value associated with the X cursor positioned by the user, and vice-versa for AutoX modes. |
Apply FFT Smooth
|
on / off |
Multiple adjacent sample averaging (smoothing) applied to underlying time-domain results prior to FFT calculation, and also applied to frequency-domain results. |
Show S21 Plot
|
on / off |
Displays final result Insertion Loss S21 plot |
Show DUT Plot
|
on / off |
Displays underlying incident response plot |
Show Through Plot
|
on / off |
Displays underlying reflected response plot |
See Also