Return Loss S11 Application (Option)
![]()
The Return Loss S11 Application is available as an option on every STEPScope. If your STEPScope does not have this option installed and you would like to order it, please contact BitWise Laboratories.
The Return Loss S11 application displays a chart showing the frequency domain reflected response a channel has to a step signal injected into the channel.
Chart cursors can be enabled in the Chart Cursor Settings – accessed by clicking the settings wheel at the upper right of the chart.
|
|
|
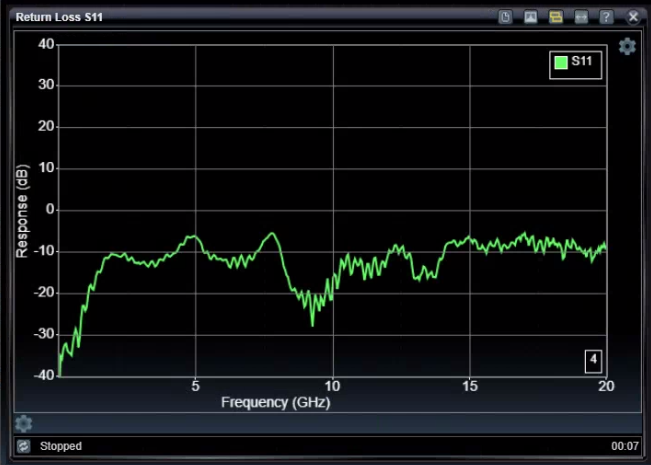
This demonstrates signal energy being rejected or reflected back from the channel and thus not efficiently being communicated onward. This can occur when the forward pulse encounters an impedance discontinuity, for example. The reflected energy is shown in the frequency domain so you can identify specific frequency components that are being reflected. This is a very useful tool to identify components that hinder wide bandwidth communications. This tool can be used in conjunction with the TDR tool to identify impedance discontinuities and time-domain disturbances that impact the reflected energy.
The formula for calculating the return loss is based on calibrations inherited from the TDR application. First, a baseline 50-Ohm termination pulse is recorded to de-embed noise in future measurements. Second, a shorted pulse is recorded to represent an incident signal. The incident signal is acquired in the time domain and then converted to the frequency domain. Third, while running, the DUT pulse is recorded to represent the reflected signal. This is also converted to the frequency domain, and the ratio of these two values (reflected/incident) combine to create the linear Gamma ratios showing how much of the incident signal is reflected for individual frequency components. It common to translate these results into a logarithmic scale using the familiar equation: dB = 20 * log10( gamma ).
Use TDR Calibration to De-Embed Channel
It is necessary to perform TDR calibrations before using the Return Loss S11 application. This provides the system with de-embedding information to remove the impacts of the measuring device and any cabling that may be required to connect to the DUT. When performing the TDR calibrations, you will be asked to provide a short condition and a 50-Ohm termination condition. The location along the channel where you provide these conditions will become the "reference plane," and any effects up to this location will be de-embedded from the final results so the chart will reflect the channel beyond this reference plane.
Tuning the Pulser
Pulser parameters such as pulse amplitude and pulse rate can be set in the Pulser Configuration menu – accessed via the Pulser icon in the Status Bar. Higher pulser amplitudes will provide more energy for better calculations, as will more-frequent pulses from higher pulse rates. Longer pulse intervals can provide needed fidelity at lower frequencies but also translate to higher noise-floor for measurements. New TDR de-embedding calibrations are required if pulser characteristics change.
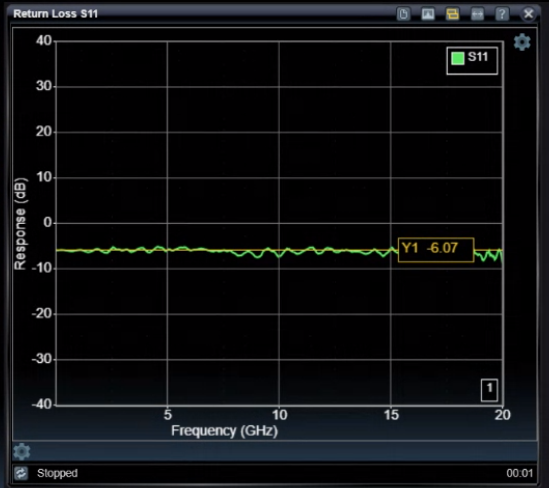
Here is an example of a modest -3dB attenuator. Notice the reading at DC is -6dB, which is twice the value of the attenuator because the pulse travels through the attenuator twice.
Return Loss S11 Settings

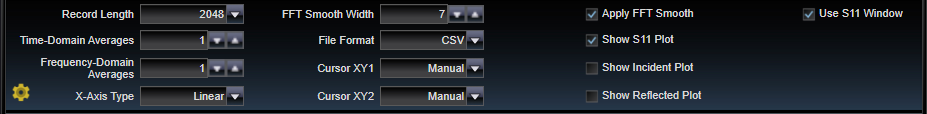
Record Length
|
512, 1024, 2048, 4096, 8192 |
Number of Frequency-domain bins used when calculating FFT results. To calculate these results two times this number of underlying time samples are acquired. |
Time-Domain Averages
|
1 − 20 |
Number of Time-domain buffers averaged together into each Frequency-domain FFT result |
Frequency-Domain Averages
|
1 − 20 |
Number of Frequency-domain buffers averaged together into each displayed result. |
X-Axis Type
|
Linear, Log |
X-axis format of x-axis frequencies (GHz). |
File Format
|
CSV, S1P_RI, S1P_DB |
Format for download file. S1P file formats provide selection to display information in (dB, Angle) or in (Real, Imaginary) pairs. |
Cursor XY1
|
Manual, AutoYS11, AutoYIncident, AutoYReflected, AutoXS11, AutoXIncident, AutoXReflected |
Selects automatic modes for cursor-pair X1 and Y1. For AutoY modes, the Y cursor value is selected based on locating the selected Y-axis value associated with the X cursor positioned by the user, and vice-versa for AutoX modes. |
Cursor XY2
|
Manual, AutoYS11, AutoYIncident, AutoYReflected, AutoXS11, AutoXIncident, AutoXReflected |
Selects automatic modes for cursor-pair X2 and Y2. For AutoY modes, the Y cursor value is selected based on locating the selected Y-axis value associated with the X cursor positioned by the user, and vice-versa for AutoX modes. |
Apply FFT Smooth
|
on / off |
Multiple adjacent sample averaging (smoothing) applied to frequency-domain results. |
Show S11 Plot
|
on / off |
Displays final result Return Loss S11 plot |
Show Incident Plot
|
on / off |
Displays underlying incident response plot |
Show Reflected Plot
|
on / off |
Displays underlying reflected response plot |
|
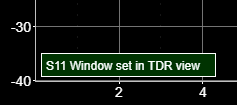
S11 Window |
|
|
on / off |
Select to use the current region of interest window during associated S11 analysis. This region is specified on the TDR chart. When enabled, the S11 chart shows a message that indicates S11 Windowing is in use. See below. |
See Also