Step Response Application

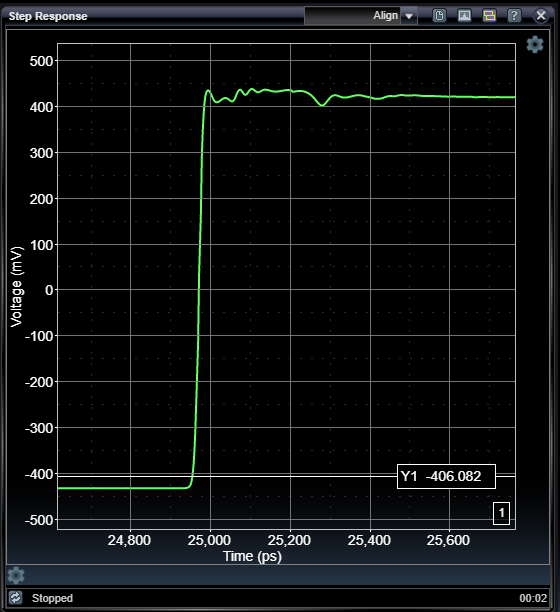
In order to perform TDR/TDT and S-parameter analysis, the STEPScope™ must measure the step response of the Device Under Test (DUT). This involves sending an electrical step into the DUT, and then measuring any energy that is reflected by the DUT. In order to improve the fidelity of the step response measurement, the STEPScope transmits a train of steps, with each step far enough apart to not interfere with the previous step response. The STEPScope then samples many step responses to produce a live view of the DUT's step response.
To learn more about the STEPScope's operation, read Understanding the STEPScope.
Measurement parameters such as time offset, sample depth, and persistence can be set in the Step Response Settings − accessed by clicking the settings wheel underneath the chart.
Pulser parameters such as pulse amplitude and pulse frequency can be set in the Pulser Configuration menu – accessed via the Pulser icon in the Status Bar.
It is important to properly set pulser parameters so that each pulse does not interfere with the preceding pulse. This is usually only of concern for DUTs that have very long electrical paths.
Chart cursors can be enabled in the Chart Cursor Settings – accessed by clicking the settings wheel at the upper right of the chart.
|
|
|
Step Response Settings

To change the Step Response settings, click on the settings gear underneath the Step Response Chart. Doing so reveals the following menu:
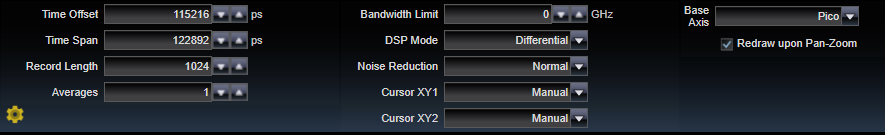
These settings control how the Step Response measurement is made.
|
Time Offset |
|
|
0 − 10,000,000 ps, ns |
Time associated with left-hand side of the chart. Units depend on the selection for Base Axis. |
|
Time Span |
|
|
0 − 1,000,000 ps, ns |
Time span associated with the full width of the chart. Units depend on the selection for Base Axis. |
|
Record Length |
|
|
10 − 10,000 |
Number of data samples in each acquisition record. |
|
Averages |
|
|
1 − 20 |
Number of acquisition records averaged together to produce each chart display. Has the effect of minimizing random impacts on the signal. |
|
Bandwidth Limit |
|
|
0 − 500 GHz (0=Off) |
Applies single-pole FIR filter to raw acquired samples to effect bandwidth limiting. Width of filter is determined by bandwidth setting. Setting to zero (0) disables this feature. |
|
DSP Mode |
|
|
Differential, SEPositive, SENegative |
Applies digital signal processing (DSP) to acquired samples to reverse natural bandwidth limiting effects of sampling circuitry. This can slightly decrease rise time appearance and improve droop seen at very low frequencies. The nominal setting is for differential signals. |
|
Noise Reduction |
|
|
Off, Normal, Double |
Selects noise reduction processing. Normal mode removes expected measurement system interference. Double mode performs better noise reduction at the expense of twice the amount of data acquisition. Double mode also assumes significant symmetry between rising-edge and falling-edge response. |
|
Cursor XY1 |
|
|
Manual, AutoX, AutoY |
Selects automatic modes for cursor-pair X1 and Y1. For AutoY mode, the Y cursor value is selected based on locating the selected Y-axis value associated with the X cursor positioned by the user, and vice-versa for AutoX mode. |
|
Cursor XY2 |
|
|
Manual, AutoX, AutoY |
Selects automatic modes for cursor-pair X2 and Y2. For AutoY mode, the Y cursor value is selected based on locating the selected Y-axis value associated with the X cursor positioned by the user, and vice-versa for AutoX modes. |
|
Redraw upon Pan-Zoom |
|
|
on / off |
Enables automatic initiation of new acquisition after user-interface chart interactions pan or zoom. |
|
Base Axis |
|
|
Pico, Nano |
Displays base X-axis in either picosecons or nanoseconds for convenience |
See Also