Time Domain Reflection TDR Application
![]()
The TDR app displays a chart of Ohms vs. Time. This chart describes the impedance of the electrical path measured by the STEPScope™, and is calculated using the Step Response data. For more information on the theory of TDR and how this calculation is performed, see TDR Theory of Operation.
To learn more about the STEPScope's operation, read Understanding the STEPScope.
The accuracy of TDR measurement relies on properly calibrating the STEPScope for each new cable configuration. TDR Calibration is a two step process, which sets the calibration plane as well as the nominal impedance. Performing this calibration and setting other TDR parameters can be done after opening the TDR Settings – accessed by clicking the settings wheel underneath the chart.
Chart cursors can be enabled in the Chart Cursor Settings – accessed by clicking the settings wheel at the upper right of the chart.
You can select the X-axis to display in Time (ps or ns) or in Length (inches or cm). Length settings depend on your selection for Permittivity (aka Dialectric constant). Cursor measurements are shown in the selected format.
You can add a series resistance "resistivity" value that is in units of Ohms per meter, which will correct for series resistance in long measurements that cause the impedance to appear to grow over time.
Interpreting TDR Results
The STEPScope TDR app is a powerful tool for debugging RF paths, analyzing systems, and performing impedance compliance tests. Read the tips below in order to utilize the STEPScope more effectively.
1. Interpreting the Time Axis
The length of the electrical path being measured by the STEPScope corresponds to an amount of time that the Step input will take to traverse the path. This length of time is determined by the propagation velocity (a property of the transmission media's dielectric constant).
The time=0 mark in the TDR chart corresponds to the calibration plane of the test set up. This plane is set during the 'Short Calibration' process.
By setting the Permittivity value to represent the speed of transmission through the medium being tested (aka Dielectric constant), the X-axis can also be presented in terms of length instead of time.
2. Interpreting the Ohms Axis
When analyzing a transmission line, the STEPScope measures the characteristic impedance along the line. Recall that for a lossless uniform transmission line, the characteristic impedance is = √(L/C). Remembering this ratio helps interpret the Ohm axis. Generally, spikes in the TDR chart higher than the nominal characteristic impedance correspond to sections of the transmission line that are too inductive. Conversely, dips in the TDR chart lower than the nominal characteristic impedance correspond to sections that are too capacitive.
- For example, when analyzing a PCB microstrip from a connector into an IC that is designed as a 50 ohm transmission line, hopefully the TDR chart shows a flat line at 50 ohms. It might be the case that the TDR chart shows a slight dip near the end of the line. This could indicate that the pad underneath the IC's pin is too large, and is coupling too capacitively to the ground plane below. Shrinking the pad may help fix this.
If the Permittivity value is set properly, you can also use the Resistivity value to account for series resistance that cause impedance Ohms values to increase with propagation.
3. Interpreting Terminations
Terminations are resistive paths between the two legs of a transmission line. If a transmission line is terminated with the same impedance as the characteristic impedance, no energy will be reflected at the termination. In this case, the STEPScope will not measure reflected energy, which is indistinguishable from an infinitely long transmission line. In a TDR chart, these cases look identical with a flat line extending to infinite time.
Terminations that don't match the characteristic impedance also manifest as flat lines extending to infinite time, but they will show the impedance of the termination in ohms.
- For example, a 50 ohm transmission line that feeds into an amplifier terminated at 50 ohms should simply show a flat line on the TDR chart. If the amplifier's terminations are actually 48 ohms, however, then the TDR chart will drop to 48 ohms at the time corresponding to the termination and then stay a flat line.
Use of Permittivity and Resistivity
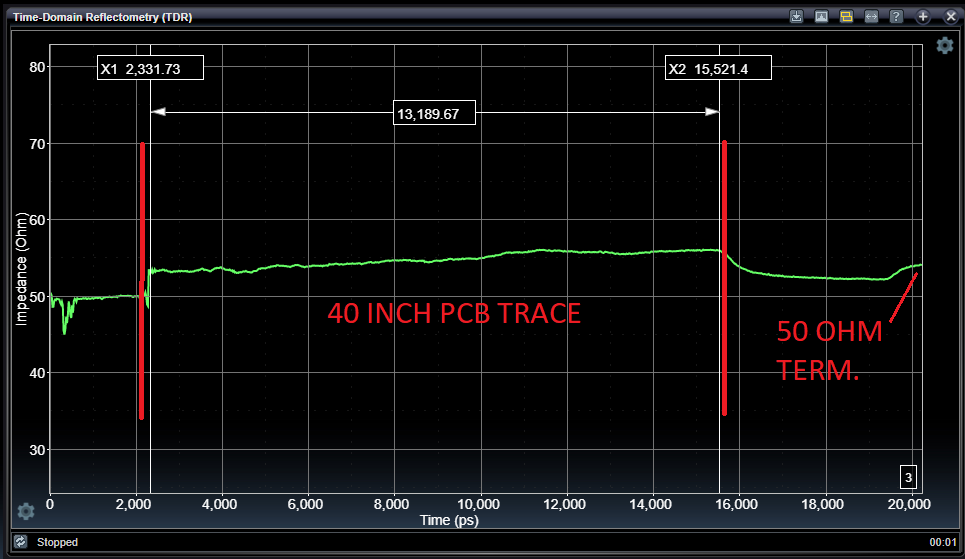
The following TDR chart shows an example DUT consisting of a leader cable connected to a 40-inch trace on an FR4 PCB, subsequently connected to another leader cable connected to a 50 Ohm terminator. Notice by default the X-axis is in Picoseconds.
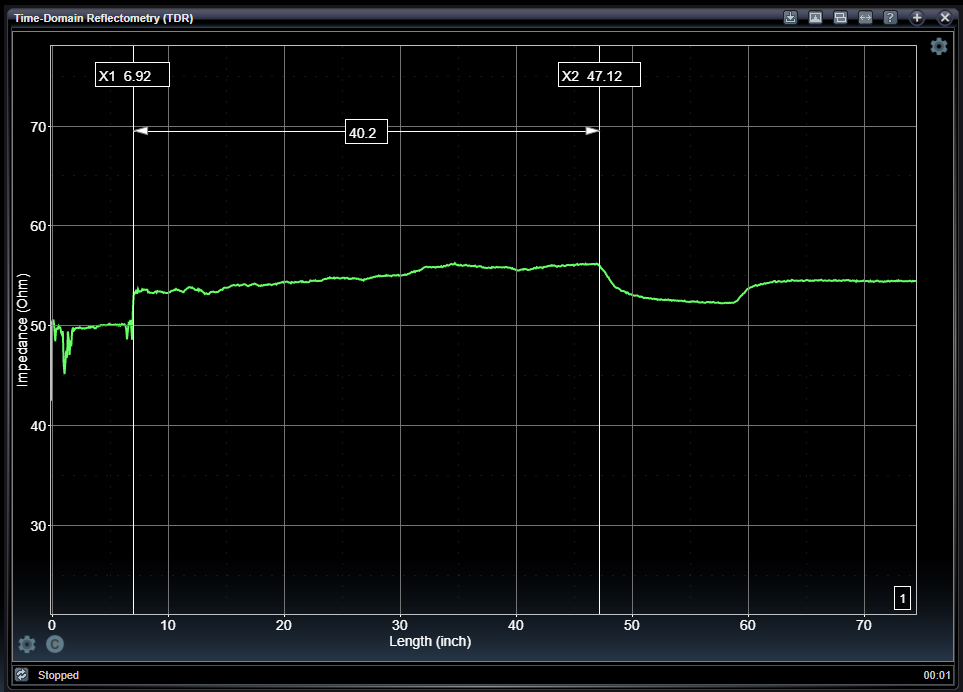
By selecting the Permittivity value to be 3.8 because the trace PCB is made from an FR4 material, the analysis can present the X-axis in terms of inches as shown below. Notice now you can see the delta-cursor measurement is showing the 40 inch length of trace on the PCB.
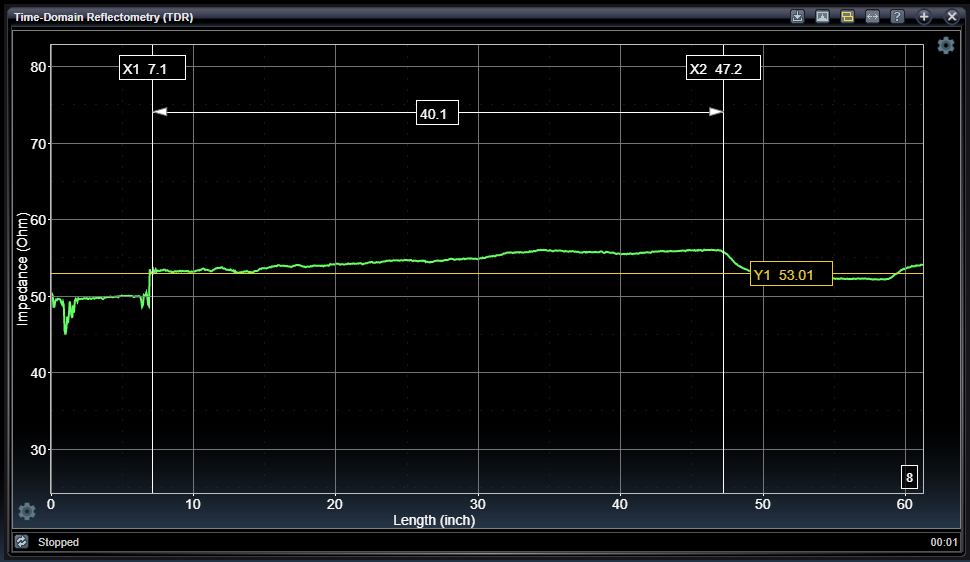
In the chart above, you can see the Ohm Y-axis measurement is creeping upwards over time from its initial value of about 53 Ohm to a terminal value of about 56 Ohm. This rise comes from accumulated serial resistance encountered during the round-trip propagation of the TDR test pulse through the circuit. This rise over 40 inches is roughly equivalent to the rise over 1 meter, so setting the Resistivity value to 3 Ohm-meters should correct for the series resistance in the DUT as shown below:
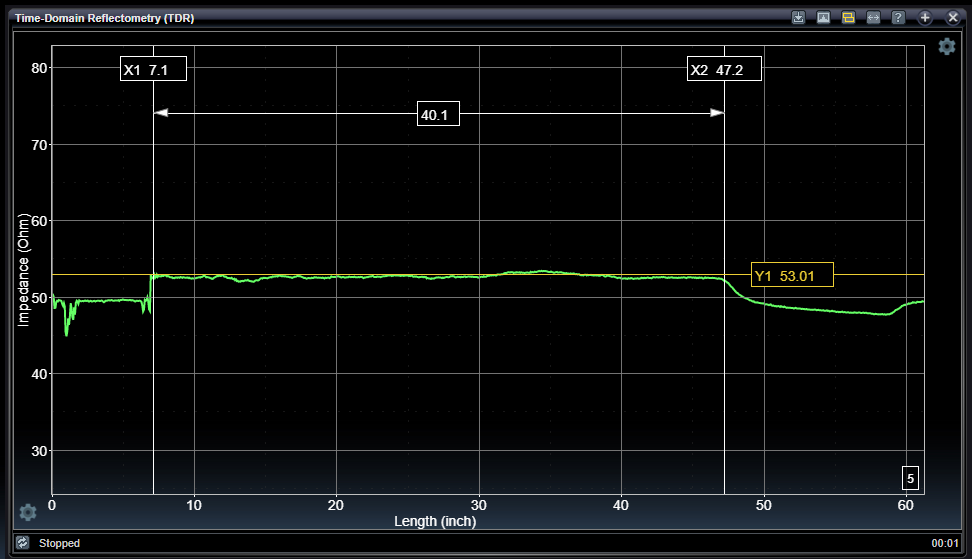
Now you can see the impedance throughout the trace DUT is consistent and the termination at the end of the cable is reading 50 Ohm.
TDR Settings

To change the TDR settings, click on the settings gear underneath the TDR Chart. Doing so reveals the following menu:
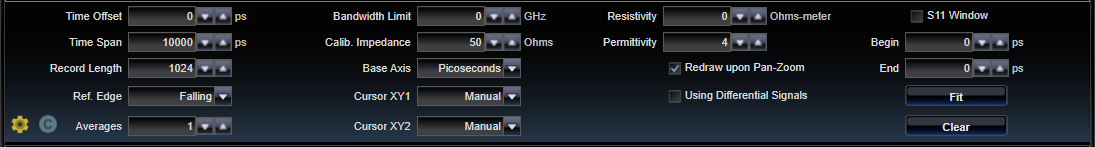
These settings control how the TDR measurement is made.
|
Time/Length Offset |
|
|
-1e6 − +1e6 ps, ns, inch, cm |
Time or length associated with left-hand edge of chart. Units depend on the selection for Base Axis. |
|
Time/Length Span |
|
|
0 − 1e6 ps, ns, inch, cm |
Time or length duration for full-width of chart. Units depend on the selection for Base Axis. |
|
Record Length |
|
|
0 − 16384 |
Number of discrete samples acquired over the time interval defined by the Time offset and the Time Span. |
|
Averages |
|
|
1 − 20 |
Determines the number of records containing the record length number of samples, which are averaged together to form the final result. More averaging has the effect of eliminating noise. |
|
Reference Edge |
|
|
Rising, Falling |
Selects which edge of the Step Response is used to perform the TDT analysis. It may be important to select faster edge if rise time is different from fall time. |
|
Bandwidth Limit |
|
|
0 − 500 GHz (0=Off) |
Applies single-pole FIR filter to raw acquired samples to effect bandwidth limiting. Width of filter is determined by bandwidth setting. Setting to zero (0) disables this feature. |
|
Calibration Impedance |
|
|
1 − 1000 Ohms |
Set this value to the nominal impedance of your calibration kit. This is typically set to 50 Ohms for both single-ended and differential wiring configurations. |
|
Cursor XY1 |
|
|
Manual, AutoX, AutoY, S11Window |
Selects automatic modes for cursor-pair X1 and Y1. For AutoY mode, the Y cursor value is selected based on locating the selected Y-axis value associated with the X cursor positioned by the user, and vice-versa for AutoX modes. The S11Window mode is used in conjuction with the S11Window enable checkbox. This enables interactive selection of the Begin Window parameter, based on the cursor X1. |
|
Cursor XY2 |
|
|
Manual, AutoX, AutoY, S11Window |
Selects automatic modes for cursor-pair X1 and Y1. For AutoY mode, the Y cursor value is selected based on locating the selected Y-axis value associated with the X cursor positioned by the user, and vice-versa for AutoX modes. The S11Window mode is used in conjuction with the S11Window enable checkbox. This enables interactive selection of the Begin Window parameter, based on the cursor X2. |
|
Base Axis |
|
|
Pico, Nano, Inch, Centimeter |
Displays base X-axis as either time in picoseconds or nanoseconds, or, in conjunction with the Permittivity value, as length in inches or centimeters. |
|
Permittivity |
|
|
1 - 50 |
Relative permittivity representing the speed of transmission through the DUT medium in relation to the speed of light. This value enables conversion from time to length. Technically, this is effective permittivity, which may be slightly different than canonical permittivity based on the type of the PCB trace such as microstrip, stripline, and coupling factors. The default is 4, which is roughly set for FR4 PCB material. FR4 permittivity values can range from 3.8 to 4.4 depending on glass and epoxy ratio. |
|
Resistivity |
|
|
0 - 50 Ohms per meter |
Ohm per meter representing serial resistance build-up over time that occurs in TDR t Ohms conversion. This factor can correct the Ohm measurement Y-axis values as time or length increases. This effect can be particularly helpful on very long measurements, such as lengthy cable DUTs. One technique for locating the appropriate resistivity value is to place a 50 Ohm terminator at the end of the cable and to adjust the resistivity so that measurement of that location is 50 Ohms. |
|
Redraw upon Pan-Zoom |
|
|
on / off |
Enables automatic initiation of new acquisition after user-interface chart interactions pan or zoom. |
|
Using Differential Signals |
|
|
on / off |
Select whether the STEPScope is analyzing a differential or single-ended DUT. If single-ended, connect the + terminal to your DUT, and terminate the - terminal with a quality 50 ohm termination. |
|
S11 Window |
|
|
on / off |
Select to use the current region of interest window during associated S11 analysis. When enabled, the current region of interest is shown on the chart. This region is selectable by entering values in the Begin/End properties, or by using the S11Window cursor mode in conjunction with cursors X1 and X2. Enabling S11 Windowing doesn't change the results on the TDR chart. It limits what part of the waveform is used to calculate S11 analysis results on the S11 chart. This requires the S-parameters option. The current S11 Window is shown with a green background on the TDR chart when S11 Windowing is enabled. |
|
Window Begin / End |
|
|
Begin - ps End - ps |
Displays current region of interest window, selectable using cursor X1 and X2, or directly settable by entering specific values to these parameters. Beginning and ending parameters may be reversed and processing still occurs as expected. |
|
Window Fit |
|
|
Command |
Sets the current region of interest to occupy the entire range of the current chart view. |
|
Window Clear |
|
|
Command |
Clears the region of interest window |
TDR Calibrations

To calibrate the TDR measurements before use, click on the calibration icon underneath the TDR Chart. Doing so reveals the following panel:
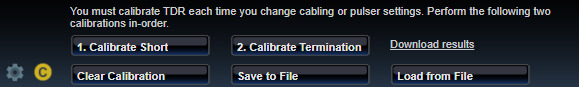
These settings control performing the calibration as well as managing calibration files. When you run a calibration it is installed as the current calibration for use. You can save the current calibration into a named file by pressing the "Save to File" button. You can load a previously saved calibration file by pressing the "Load from File" button. Once you load a calibration file, that file name is stored in the current system configuration and reloaded upon power-up. You can save configurations into separate files using configuration management features found in the Program Menu. By storing different calibration files in different configurations, you can easily restore specific configurations for making measurements with different calibrations.
|
Calibrate Short |
|
|
-- |
Gather TDR Calibration data when pulse is reflected from a Short condition. You will be prompted to connect RF short devices during the calibration process. |
|
Calibrate Termination |
|
|
-- |
Gather TDR Calibration data when pulse is not reflected from a terminated condition. You will be prompted to connect RF termination devices during the calibration process. |
|
Download results |
|
|
-- |
Download the current TDR calibration to your browser as a CSV file. You can examine this using a spreadsheet program. |
|
Clear Calibration |
|
|
-- |
Erase current TDR Calibration. You will need to perform a calibration before using TDR again. |
|
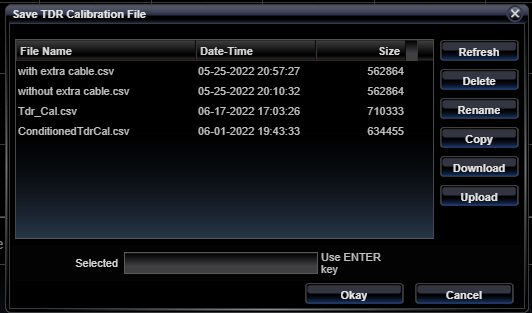
Save to File |
|
|
-- |
Stores the current TDR calibration into a file specified in the popup file selection dialog. |
|
Load from File |
|
|
-- |
Loads the file specified in the popup file selection dialog into the current TDR calibration and records this file as the file to be loaded whenever the current configuration is restored. |
See Also