BER Tub Application

The BER Tub Application measures a traditional bit error rate "Bathtub" curve as measured on the Calibration input. This plots the bit error rates across the time of one bit interval.
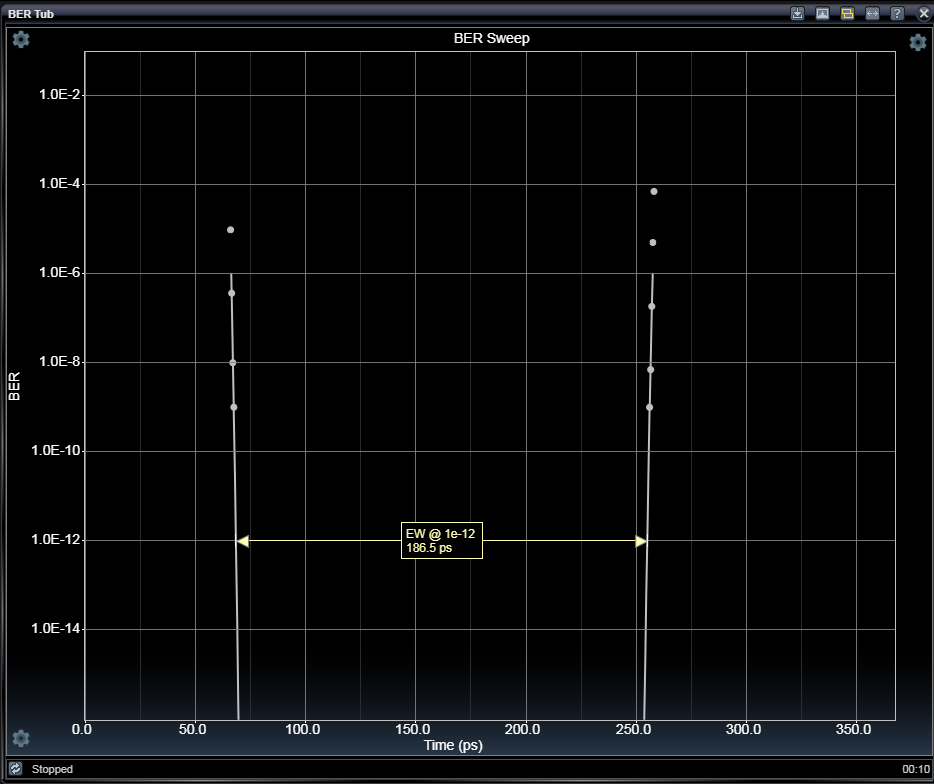
Tubs can be time-centered on the eye opening (see below) or can be centered on the eye crossing. A Tub centered on the eye opening usually takes on the shape of a "bathtub," which is where the name comes from. Tubs are a collection of many short bit error rate measurements throughout important time offsets within the bit period. Calibration input bathtubs can be performed on both direct calibration input signals as well as on deferred decision inputs (where the thresholds and time offsets which cause upstream bit sampling are different from the traditional threshold and delay used for the normal Calibration input).
The BER Tub Application also performs analysis on the BER measurement results allowing for computation of things like eye width at proscribed bit error rate level, total jitter, random jitter, deterministic jitter, etc. These analysis results are available here in the user interface (click on the gear icon at the upper left of the Tub chart) and through remote control.
There are a number of parameters to setup when making a bathtub measurement. Most of these parameters effect the speed of the analysis, so they should be carefully optimized for a given application. Click on the gear icon at the lower left of the chart to access settings.
The BER Tub application locates and measures a bit transition on the calibration input signal. For the Calibration Input mode, this is accomplished by applying the Calibration Delay range while searching for a transition. At data rates below 3.5 Gbps, the delay range is not long enough to find a transition in all possible phases of the unit interval. Therefore, this analysis is most easily used above these data rates. It can still be used below this data rate, but it may be required that you modify the data signal cable length to accomplish intra-bit delay so the search will be able to find a transition. You will know this is the situation if you receive a "No Transition Found" error message.
Click on the gear icon at the upper right of the chart to access cursor controls, on the bottom-left to access settings, and on the top-left to access measurement results.
BER Tub Settings
 [bottom left]
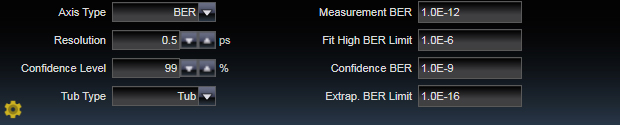
BER Tub configuration is selected using the control elements below the chart that are visible by pressing on the Settings icon.
|
Axis Type |
|
|
BER / Q |
Display the Y-axis as either BER or "Q". In random data, BER = 0.5*erfc(Q/SQRT(2)) For example, a BER of 1E-12 is approximately a Q of 7. One can think of this as the number of standard deviations in one-half of the bell-curve width at a given BER level. Measurements of Q in a truly Gaussian random distribution will appear as a straight line. This is the reason for plotting using Q: If the resulting line is straight, the distribution was random. If the line bends, it is not random. |
|
Resolution |
|
|
ps |
Resolution in X-axis for individual BER measurements |
|
Confidence Level |
|
|
% |
The confidence for each BER measurement. To achieve confidence, a prescribed number of bits must be looked at when claiming a BER value. For example, if we want to measure 1E-12 BER to a confidence of 95%, we must measure 3*1E12 bits. Confidence level dramatically impacts test time as it sets the number of bits that need to be measured at each point. |
|
Tub Type |
|
|
Tub / Peak |
The visual center of the analysis can be set to "Tub" or "Peak". A "Tub" view centers the diagram on the eye opening, while the "Peak" view centers the diagram on the eye crossing. All analysis measurements are available in both display formats. |
|
Measurement BER |
|
|
|
Once analysis is complete, interpolated data based on the actual measurements will be used to define the extremes of the measured bit error rate values at different time instants. By setting the Measurement BER, a cursor will indicate the numeric measurement for the eye width or eye jitter (depending on Tub/Peak setting) at that bit error rate level. |
|
Fit High BER Limit |
|
|
|
Measured BER points with BER worse than this level will be included in the extrapolation fit. |
|
Confidence BER |
|
|
|
Confidence BER is the maximum BER depth where the confidence percent is computed. For example, if we want to measure 1E-12 BER to a confidence of 95%, we must measure 3*1E12 bits. Confidence BER dramatically impacts test time as it sets the number of bits that need to be measured at each point. |
|
Extrap. BER Limit |
|
|
|
Extrapolation BER limit is the lowest bit error rate limit drawn for the extrapolation line. |
BER Tub Results
[top left]
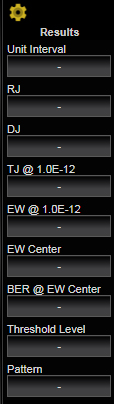
BER Tub measurement results are displayed on the side panel that is visible by pressing on the Results icon. These measurements are updated upon completion of the tub analysis.
|
Unit Interval |
|
|
|
Report of unit interval |
|
RJ |
|
|
|
Random Jitter |
|
DJ |
|
|
|
Deterministic Jitter |
|
TJ @ 1.0E-12 |
|
|
|
Total Jitter |
|
EW @ 1.0E-12 |
|
|
|
Eye Width |
|
BER @ EW Center |
|
|
|
BER at Eye Width center |
|
Threshold Level |
|
|
|
Report of threshold level |
|
Pattern |
|
|
|
Report of data pattern |
See Also
Pattern Generator Applications