BER Strip Chart Application
![]()
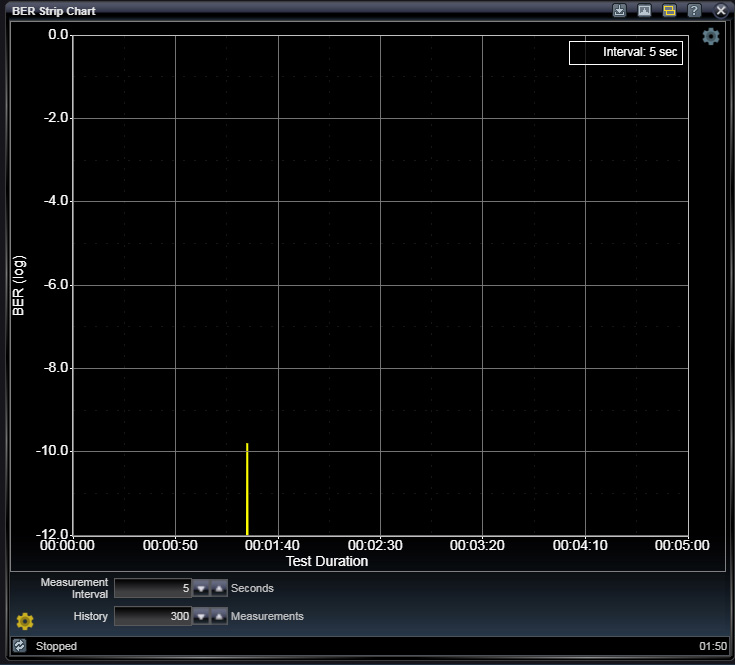
The BER Strip Chart Application plots the measured Calibration input bit error rate against time to show trends in error measurements. The number of plotted points and the sampling interval are adjustable. It is common to look at BER Strip Charts when making circuit adjustments to see if the adjustment made performance better or worse.
Click on the gear icon at the bottom left of the chart to access settings.
Click on the gear icon at the upper right to access cursor controls.
BER Strip Chart Settings

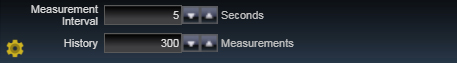
Strip chart control settings provide configuration for how many measurements to provide and for what interval of time each represents.
|
Measurement Interval |
|
|
Seconds |
Seconds between measurements |
|
History |
|
|
Measurements |
Number of items in history record |
See Also
Pattern Generator Applications