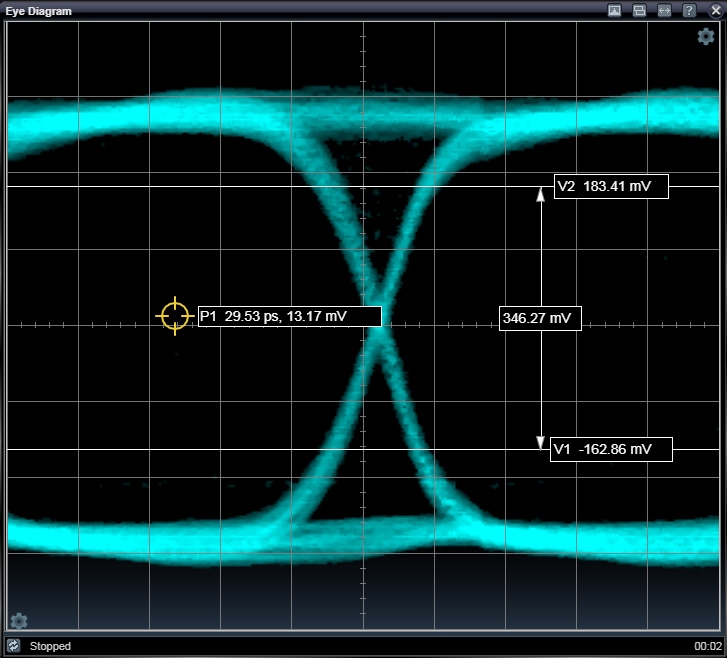
Eye Diagram Application
The Eye Diagram Application creates a traditional eye diagram view of the Calibration input signal. This is a two-dimensional probability density function that accumulates more brightness where sampled signals occur more often. This application view can show the relative quality of the eye opening used when making bit decisions. The reference point, P1, easily shows how the sampling decision point compares to the eye opening.
The eye diagram is really a quasi-eye diagram because the sampling mechanism is not the same as a traditional oscilloscope. Some dots may occur inside normally black region in the center of the eye because of pattern properties. This would not happen in a traditional oscilloscope. Still, this view is very helpful to qualitatively compare signal eye performance including rail flatness, voltage noise, jitter, and edge rates.
Calibration input eye diagrams can be performed on both direct calibration input signals as well as on deferred decision inputs (where the thresholds and time offsets which cause upstream bit sampling are different from the traditional threshold and delay used for the normal Calibration input).
Click on the gear icon at the bottom left of the chart to access settings.
Click on the gear icon at the upper right of the chart to access cursor controls.

Eye Diagram Settings

The Eye Diagram Settings allow you to change the vertical and horizontal scale of the eye diagram view. Scales are set on a per division basis. There are 10 horizontal divisions and 8 vertical divisions in the entire diagram.
|
Volts / Div |
|
|
mV |
milliVolts per vertical division |
|
Scale |
|
|
% |
Scale percentage used to correct for external attenuation in signal path. 100% setting scales the input by a factor of 1. 200% setting scales the input by a factor of 2. |
|
Time / Div |
|
|
ps |
picoseconds per horizontal division |
See Also
Pattern Generator Applications

