Data Statistics Application

The Data Statistics Application provides some basic information about the mark density of the data bits being examined during the most recent run session. While running, the Data analysis features grab short groupings of consecutive bits at a time, and analyze them. The intervening periods are discarded. Algorithms are careful to only present statistical results for the portions of time that were properly analyzed. As long as analyzed and measured situations are the same as what may be occurring during unanalyzed and unmeasured times, these short captures can represent what is happening in your system, even though only a small amount of actual data bits have been analyzed and measured.
The Data Statistics application calculates the number of marks (1's) and spaces (0's) during acquired captures and calculates mark density for display in the selected channels.
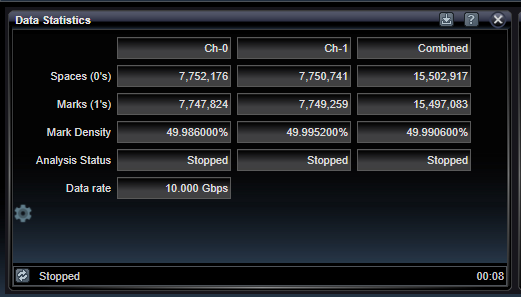
Spaces (0's)
Indicates the number of 0's encountered during the analysis run session. Only the portions of time able for acquisition are included.
Marks (1's)
Indicates the number of 1's encountered during the analysis session. Only the portions of time able for acquisition are included.
Mark Density
Indicates the Mark Density, which is the number of 1's divided by the number of bits examined. For example, in a pattern of alternating 1's and 0's, the mark density is always 50%. PRBS7 pattern has 64 1's and 63 0's, so its mark density is 50.03937%, if the calculation is based on a perfect multiple of the pattern length, which is 127 bits. For comparison, a PRBS31 pattern has 1,073,741,824 1's and 1,073,741,823 0's, so its mark density is 50.000000002%, if the calculation is based on a perfect multiple of th epattern length, which is 2,147,483,647. However, within these 2 trillion bits, there are expanses of the pattern that vary significantly from the perfect mark density. See the Data Wander Histogram Application for a way to discover mark density variations within a long pattern like this.
Analysis Status
Indicates whether the data analysis features are running or not.
Data Rate
Indicates the per-channel bit rate in Gbits/sec. This will be equal to to the clock rate in GHz if the incoming clock is a full-rate clock. If it is a half-rate clock, it will be twice the clock rate.
Data Statistics Settings

Strip chart control settings provide configuration for how many measurements to provide and for what interval of time each represents.
|
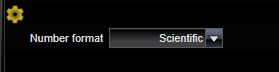
Number Format |
|
|
Decimal or Scientific |
S elects to display large integers as Decimal numbers with commas, or as Scientific numbers with exponents. |
See Also
Bit Error Location Analyzer Group Tabs