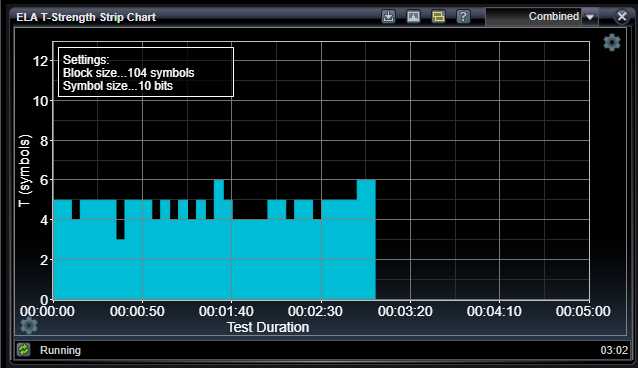
ELA T-Strength Strip Chart Application

The ELA T-Strength Strip Chart Application displays a running log of the maximum number of symbol errors encountered in all the blocks analyzed in each interval of measurement. Blocks are defined by selecting a number of bits in each symbol as the Symbol Size in the ELA Console settings, and by selecting a number of symbols in each block as the Block Size in the settings below. The measurement intervals is a number of seconds defined in the settings below. Each vertical bar on the display represents one interval of measurement, and the height of the bar indicates how many symbol errors occurred during that interval.
This analysis is useful to determine if error-producing syndromes may be temporary or if and how much they vary from one measurement interval to the next. For example, if while running this analysis, you stress your system by elevating the temperature, you can see if errors increase as a result. Particularly in systems with error correction architectures that specify a certain correction strength (T), this analysis can indicate whether the errors in an underlying raw channel are ever too much to be corrected by the error correction system.

ELA T-Strength Strip Chart Settings

The settings below enable you to configure the block size, measurement interval, and amount of history for the ELA T-Strength Strip Chart application. The number of bits in each symbol is selected in the ELA Console settings

|
Block Size |
|
|
Decimal, >0 |
Specifies the number of symbols that define a block. Symbols may be individual bits or they may be groups of consecutive bits, selected in the ELA Console settings. |
|
Measurement Interval |
|
|
Decimal number of seconds, >0 |
Specifies the number of seconds for each bar in the display, known as the measurement interval. |
|
History |
|
|
Decimal, >=10 |
Specifies the number of historical measurements maintained for display. |
See Also
Bit Error Location Analyzer Group Tabs
Bit Error Location Analyzer Status Bar